We’re proud to announce that we’ve added a major new feature to Kitely Market: detailed, actionable analytics. This new system enables merchants to track how their store performs, and gives them insights on how to improve their sales. In addition to its already considerable utility, the analytics system is also a prerequisite for several exciting features that we’ll be rolling out in the coming months. These features will help make Kitely Market the most advanced virtual-goods marketplace available on any virtual world platform.
Today’s update also includes a couple of other user-requested features.
Overview
Analytics provide merchants with information about how people interact with their products in the Kitely Market website: how often the products are viewed; how often people who view the products choose to buy them; which products sell best; and much more. This information is useful for deciding which new products to add to the market, and how to set prices in order to maximize sales.
Analytics are available for each product individually, as well as for the entire store as a whole.
Store Analytics
If you have a store in Kitely Market then you can get to its analytics page from the navigation menu:
This is what the Store Analytics page looks like (using a demo store, “Astoria”):
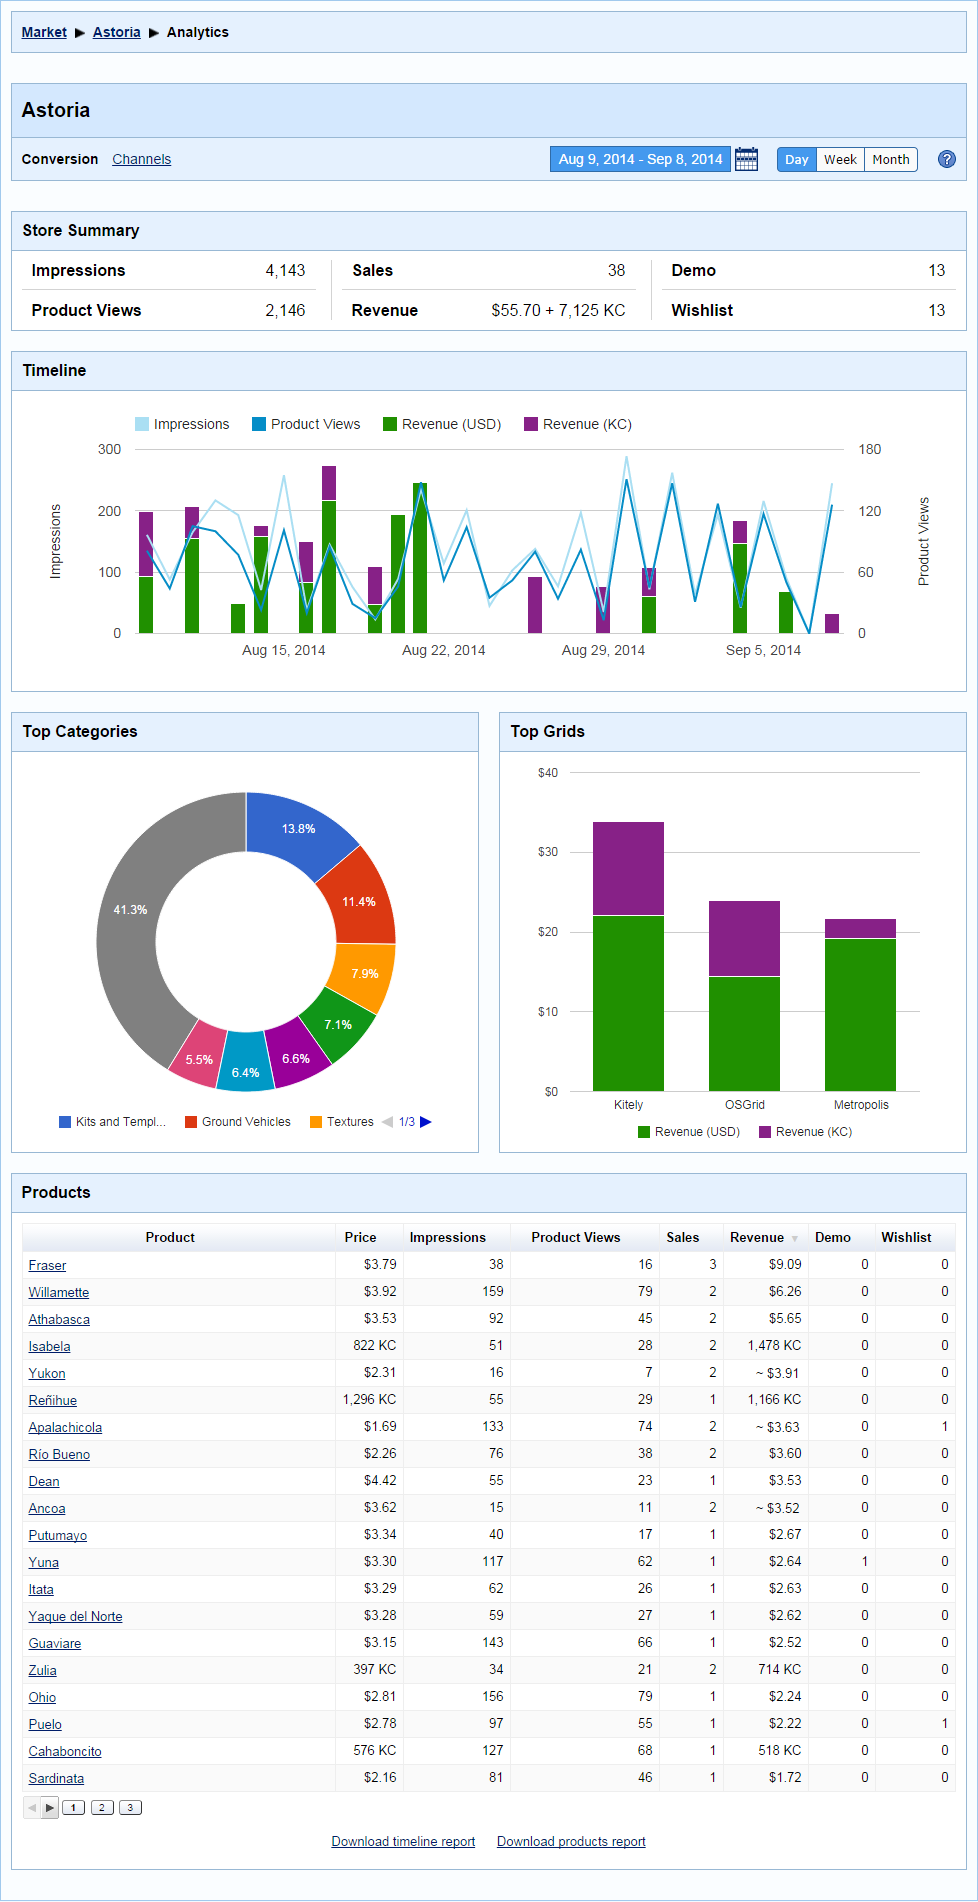
Let’s go through the parts of this page one by one.
Header
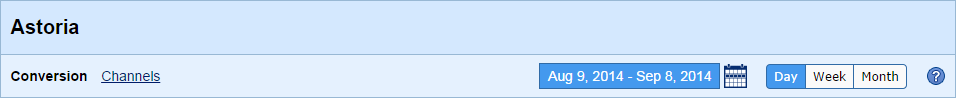
On the left side of the header you can choose which group of analytics to display:
- Conversion – shows how many times your products were viewed, and the relationship between views and sales (this relationship is called “Conversion”).
- Channels – shows how people find your products.
On the right side of the header there are date selection controls. The date picker lets you choose which dates to view (the default is the last month). The resolution buttons determine the resolution in which the data is displayed: Day, Week or Month. For example, if you choose a large date range (e.g., a year) then viewing 365 separate data points would be overwhelming. It’s more useful to view just 12 data points instead, so the resolution is automatically switched to Month (but you can then switch it to Day or Week if you want).
Store Analytics – Conversion
This section describes the charts that are shown if you select the Conversion option in the header.
Store Summary
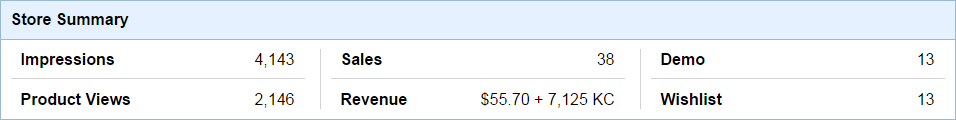
This panel shows the total number of views and sales of your products in the selected date range.
- Impressions – how many times your products’ thumbnails were viewed.
- Product Views – how many times people viewed the Product Page of your products.
- Sales – how many times your products were purchased.
- Revenue – how much you earned from these sales. The revenue is shown after Kitely’s fees have been deducted.
- Demo – how many times users sent themselves demos of your products.
- Wishlist – how many times users added your products to their Wishlists.
Timeline
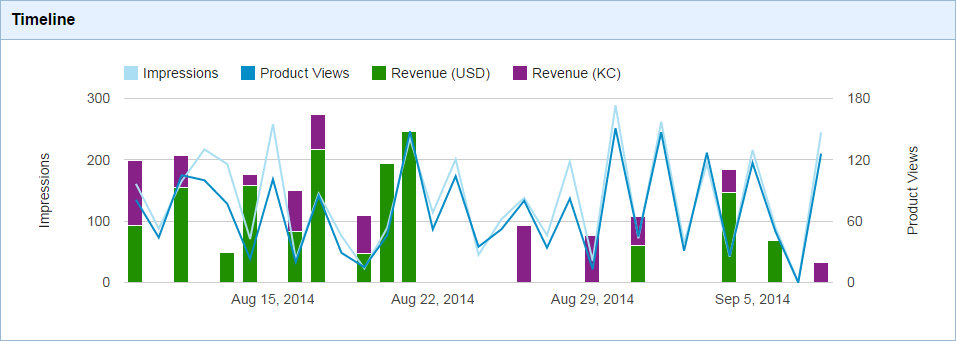
This graph shows your products’ Impressions and Product Views over the selected date range. It also shows the revenue from sales. The graph makes it easy to discover relationships between product exposure and revenue.
You can hover your mouse over any data point in the graph to get the exact value of that point.
Top Categories
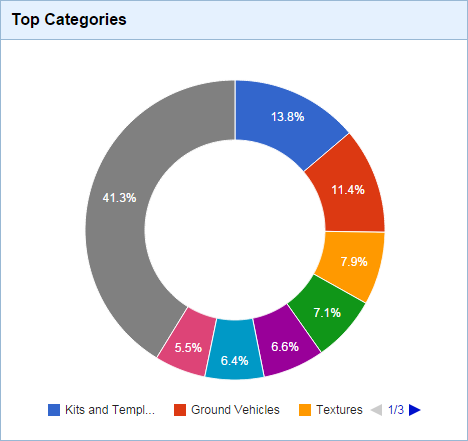
This chart shows which of your categories sell the most (by revenue). This can help you decide which types of products to add to your store.
Top Grids
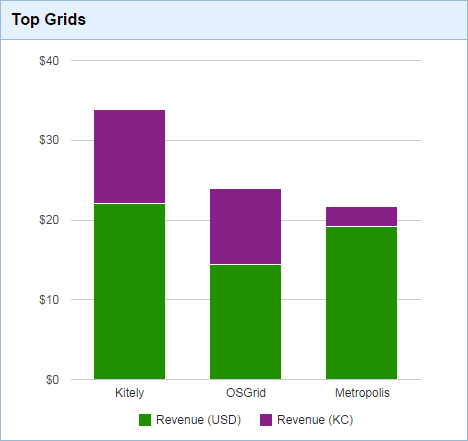
This chart shows where your products are delivered the most. (If you don’t have Exportable products then only Kitely will appear in this chart.)
Products
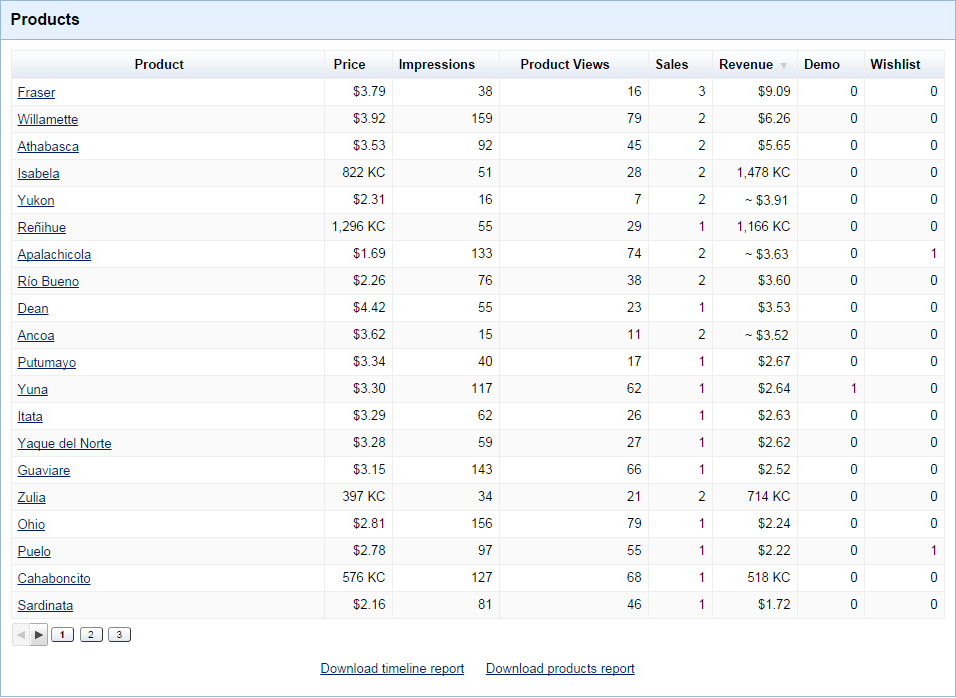
This table shows each of the products in your store, with detailed statistics about their views, sales, etc. Click on the column headers to sort by different statistics.
At the bottom of this table there are links to download CSV reports:
- Download timeline report – creates a report that contains the data shown in the Timeline graph, i.e. the total statistics of the store for each day in the date range. (Or each week or month, if that’s the resolution that you selected.)
- Download products report – creates a report that contains the data shown in the Products table.
Store Analytics – Channels
This section describes the charts that are shown if you select the Channels option in the header.
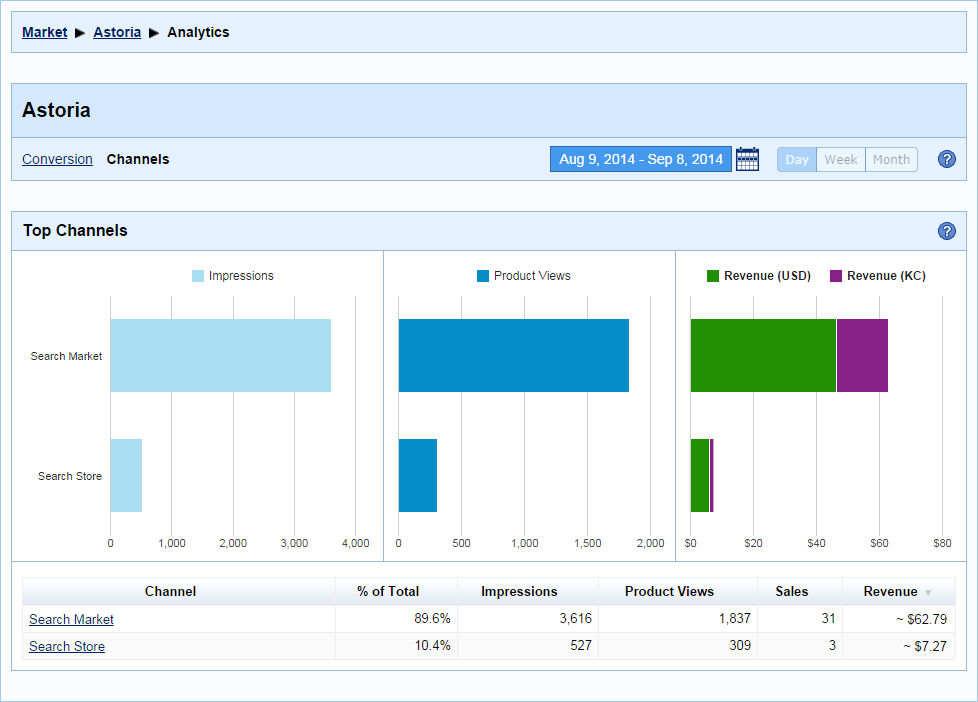
Channels track how people get to your products. Each way in which people can get to your products is a Channel. There are three top-level channels:
- Direct – the person entered your product page directly, without coming from a search page. This can happen if the person had bookmarked the URL, or refreshed the browser while on the product page.
- Search Market – the person was browsing Kitely Market, and saw your product.
- Search Store – the person was browsing Kitely Market inside your store, and saw your product. We consider this a different channel from “Search Market” because when a person is inside your store your products don’t need to compete with other merchants’ products for that person’s attention.
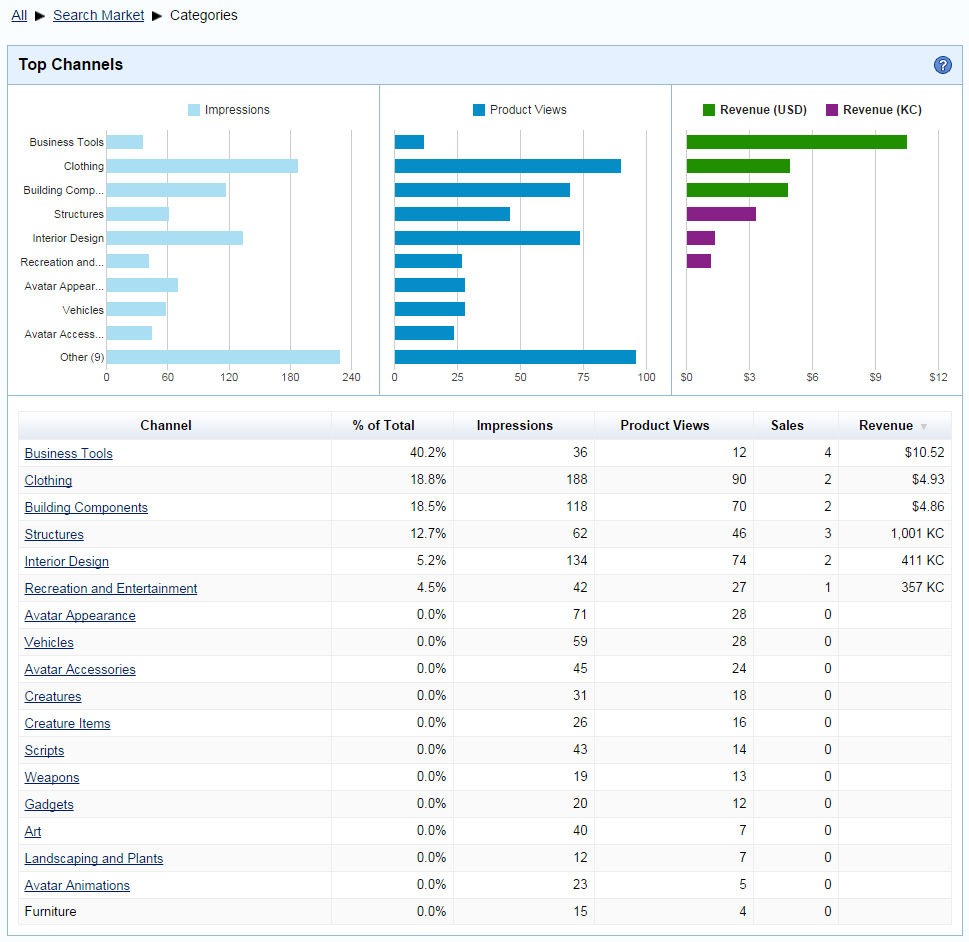
The “Search Market” and “Search Store” channels are further subdivided into these channels:
- Front Page – the person saw your product in the front page of Kitely Market or the front page of your store (i.e., without entering any specific search terms or viewing a specific category).
- Categories – the person clicked on a specific category, and saw your product inside that category.
- Keywords – the person entered text in the search field.
For example, you can see which categories people find your products in, and how that affects which of your products they actually buy. In the following chart, notice that the “Business Tools” category is over-performing: it has a low number of views but contributes the most to the merchant’s revenue. That means that perhaps the products in that category are especially desirable, or face low competition. On the other hand, the “Interior Design” category is under-performing, with high views but low sales. Perhaps something can be done to improve the products in that category.
As you can see above, the Channels page shows three charts side by side. These charts form a sort of table: each of the rows corresponds to one channel, and each of the charts shows one statistic for that channel. We use three separate charts instead of a single chart because each of these statistics (Impressions, Product Views and Revenue) uses a different scale.
You can click on the column headers in the table to change the sort order. When you do that, the charts change to show the top channels according to the current sort order. If you sort by the Sales column then the Revenue chart will be replaced with a Sales chart.
Product Analytics
All of the charts described above contain statistics for your entire store. You can also view statistics for individual products. There are two ways to get to the product analytics page:
- In the Store Analytics page, go to the Products table and click on a product name.
- In the main Product Page, click on the Analytics link.
Most of the charts shown in the Product Analytics page are identical to the charts shown in the Store Analytics page, so we won’t discuss them again. However, the following charts are unique to the Product Analytics page:
Variations
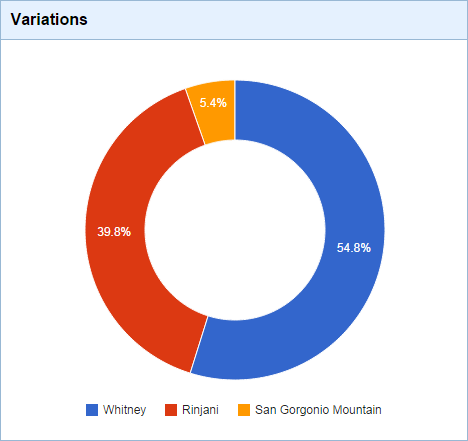
This chart shows the distribution of sales between your product’s variations. This can help you find out which colors people prefer, whether they prefer to buy Export or No-Export variations, etc.
Timeline Details
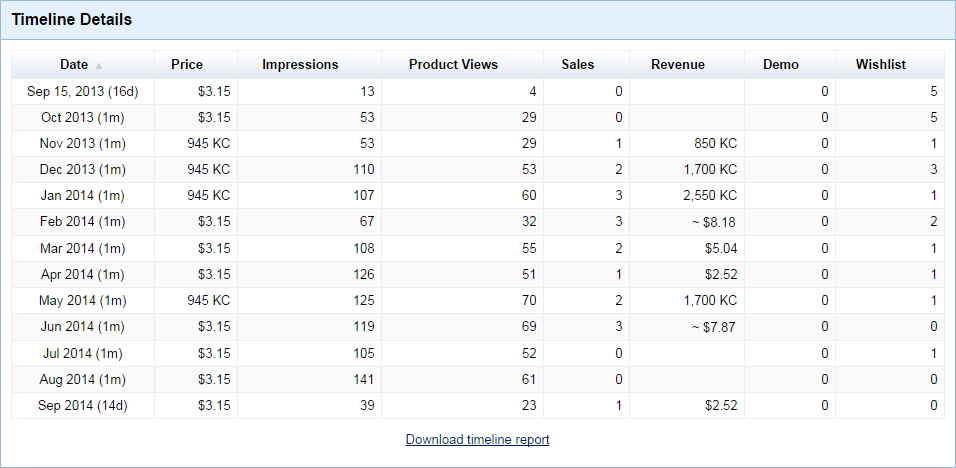
This table shows a numerical representation of the same data that is shown in the Timeline graph at the top of the page. By comparing the “Price” and “Sales/Revenue” columns you can find the effect that changing a product’s price has on its sales and revenue.
Additional Notes
You can learn more about how analytics work in the Kitely Market Analytics section of our wiki. It explains a few subtle points that we didn’t mention in this blog post.
The analytics system was completed today, September 16, 2014. Data such as Impressions, Product Views, etc. is only partially available before this date (and not available at all prior to August 8, 2014). However, sales data is fully available for all dates.
The analytics charts are updated once per day, after the day ends (in GMT time). So if you change the date range to include the current day then you’ll only see some sales information, but not full analytics. For this reason, the default date range doesn’t include the current day.
Other Features
Besides analytics, we also implemented a couple of features that were requested by our users:
Merchants have a feature available called “Test delivery” that sends their avatar a test version of a product. This feature can be used to deliver the product to other avatars as well, by changing the delivery target in the Shopping Cart. In order to make it clear which avatar will get the test delivery, we now show a message with the name of the receiving avatar before delivering the product.
In the Edit Product page, we added a Delete All button to the Variation Items table. This button deletes all of the variation items at once (instead of having to select them one at a time). This is useful when updating a variation, since at that point merchants frequently need to delete all of the existing items and upload new items.