Today we added a new feature to Kitely Market: a way to analyze the relationship between product prices and revenue. If you’re a merchant, this will help you optimize your product prices so that you can maximize your earnings.
Prices in Analytics
The Analytics pages now contain a new tab: Prices. This tab shows how products’ prices affect revenue. This information is useful for setting product prices, and for choosing the level of discounts to use in Sales Campaigns.
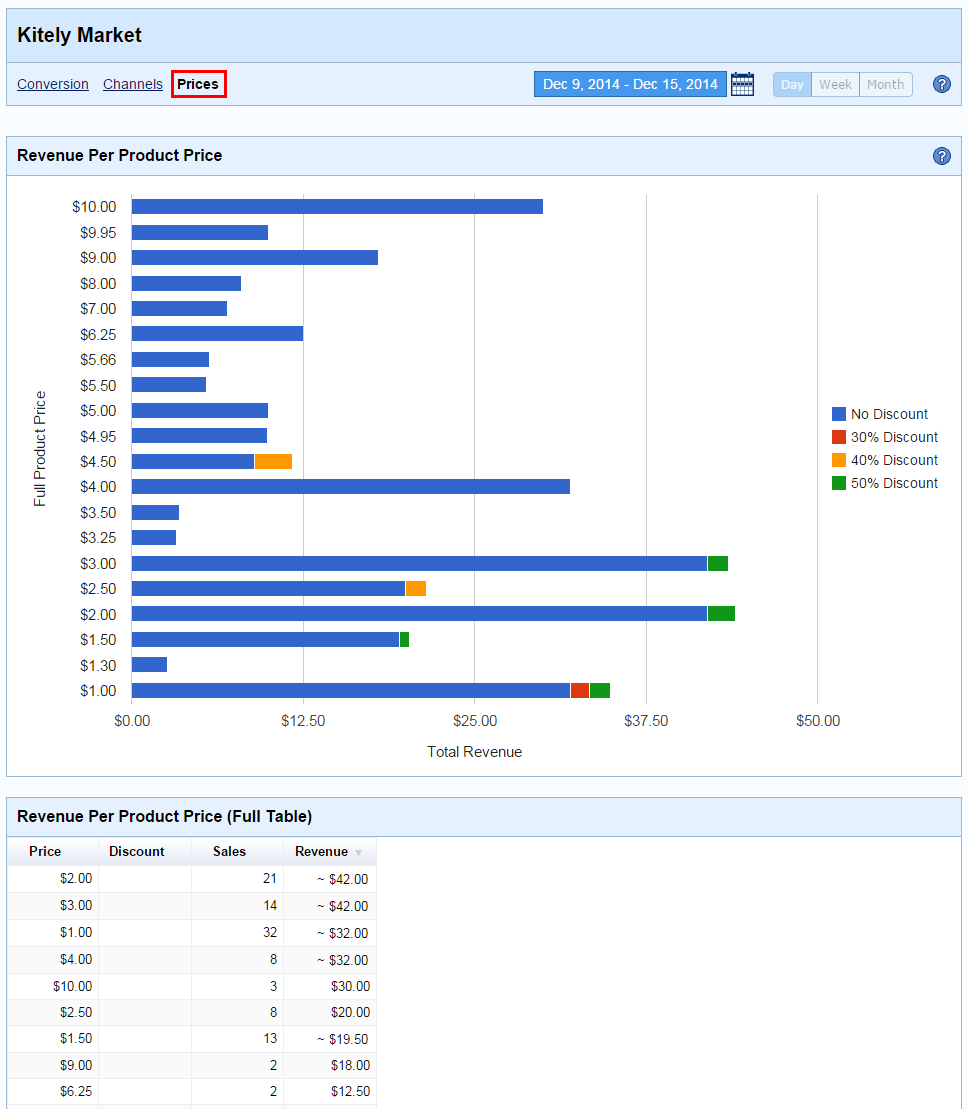
The Y Axis (labeled “Full Product Price”) shows various prices at which your products have been bought. For each price point, the X Axis (labeled “Total Revenue”) shows the total revenue that was derived from products that had that price.
If you’ve sold products using a discount (in a Sales Campaign) then the revenue bars will be subdivided to show how much revenue was made at each discount level.
How to Use This Information
This page can provide insights about how much users are willing to pay for your products. Perhaps you see that low-cost products sell best; or perhaps the other way around. This can help you set prices for your products.
This page is also useful for deciding whether to use Sales Campaigns, and which discount levels work best. For example, if you see that selling a product at a 70% discount generated more revenue than a 40% discount then you’ll know that the higher discount works better.
Note that in order to effectively analyze the effect of different discount levels you should view a single Product (and not the entire Store). In addition, remember that the selected time range affects the revenue shown: e.g., if the time range is 3 months but the product was only on sale for 1 week then you should take that into account when you evaluate the effectiveness of putting the product on sale.